
What synthetic data generation actually is
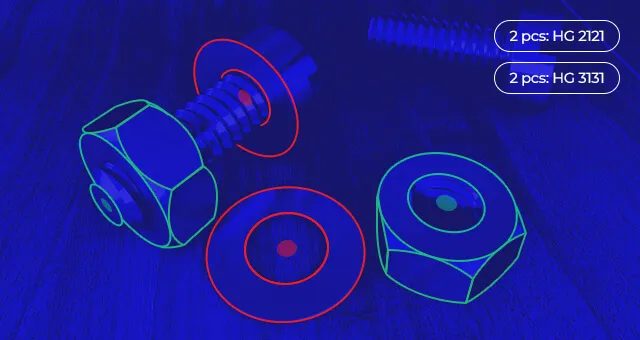
Synthetic data is data produced by a computer to stand in for data you do not have: records, images, video or text created by simulation, by a generative model, or by both together. NVIDIA's own definition of synthetic data generation is exactly that combination, and the reasons to reach for it are always one of three: the real data is scarce, it is sensitive, or labeling it is too slow and expensive.
The three motives pull in different directions, which is why advice written for one of them misleads anyone working on another. A bank generates synthetic customer records so that test systems never touch real people. A language model team generates training text because the web has run out of good examples: Microsoft's phi-4, a 14-billion-parameter model, was built on a recipe that mixes synthetic data in throughout pretraining. Neither of those problems is yours if you inspect products. Your problem is that the rare case barely exists, and every example you do have had to be labeled by a person.
The constraint is labels, not pixels
Images are cheap. A line-scan detector produces millions of frames a month. What is expensive is the part a person has to do: deciding what is in each image, and finding enough examples of the rare case to define it.
In our own inspection work this is the step that sets the schedule. Six months of classifying a large image database is what gave us the training material for the Milarex X-ray system, and that was with real contamination deliberately introduced: broken knife tips, plasters, glass.
The benchmarks moved the goalposts in 2025
For years anomaly detection results were quoted on MVTec AD, where the leading methods ended up within about one percentage point of each other, which makes comparisons meaningless. MVTec published MVTec AD 2 in March 2025 to fix that: eight scenarios, more than 8,000 high-resolution images, transparent and overlapping objects, dark-field and back-light illumination, high normal variability and very small defects, with test scenes captured under changed lighting, and part of the test ground truth kept hidden behind a public evaluation server.
The result is sobering. Methods that scored above 90% AU-PRO on the old dataset stay below 60% average AU-PRO on the new one. If a vendor quotes you a 99% number, ask which dataset, which metric and whether the ground truth was public.
Four ways to make defect data
The published approaches fall into four families, and they are not equivalent.
- Cut and paste. Take real defect images and composite them onto clean products. Crude, cheap, and still the baseline in applied work on packaged food inspection, where studies report classification accuracy at or above 94% on products such as pasta, snacks and pistachios using composited training data.
- Diffusion inpainting. Learn the appearance of a defect and paint it into a defect-free image under a mask. AnomalyDiffusion (AAAI 2024) separated what the defect looks like from where it sits, by combining a learnable anomaly embedding with a spatial embedding from the mask. SynSur, published in April 2026, chains the whole pipeline: a vision-language model writes the defect prompt, a LoRA-adapted diffusion model inserts it under a mask, a metric filter screens a candidate pool of 1,000 images, and labels are derived automatically with no manual annotation.
- Physics and geometry. Instead of generating appearance, generate the measurement. Zeegers and colleagues (Expert Systems with Applications, 2022) CT-scan a handful of representative objects, segment the volumes, and then render virtual X-ray projections whose labels are exact by construction. They report that fewer than 10 scanned objects are usually enough for adequate detection performance in an industrial setting, and higher accuracy than training on manually annotated radiographs.
- Full 3D simulation. Build the station in a renderer and vary what the camera sees: angle, distance, lighting, product position, occlusion. This is what NVIDIA's Omniverse and Cosmos tooling is aimed at, with world models adding photorealism to close the gap between a rendered frame and a real one. It is the strongest option when the thing you cannot collect is variation rather than the defect itself, and the weakest when the defect's appearance is subtle and you would have to model the physics of it to get it right.
What the evidence actually supports
The consistent finding across these papers is unglamorous: synthetic defects do not replace real ones, they stretch a small real set. SynSur trained detectors under four regimes, real only, synthetic only, mixed and union, across YOLO-family and transformer detectors, and concludes that synthetic-only training does not replace real data, while augmenting a scarce real set substantially narrows the gap to full real-data training. Its cross-domain test suggests the pipeline is portable, with the caveat that each domain needs its own adaptation and annotation quality control.
Two second-order lessons are worth taking from the same papers. Filtering matters: generating a thousand candidates and keeping the best by a quality metric is part of the method, not an optimization. And label fidelity is the hidden advantage of the physics route, because a rendered projection comes with its own ground truth, while a painted defect needs a mask you have to trust.
There is also a failure mode with a name. Shumailov and colleagues showed in Nature in 2024 that a generative model trained again and again on its own output degrades, losing the tails of the distribution first, which in inspection terms means losing exactly the odd defects you wanted. The practical answer is in a 2024 follow-up by Gerstgrasser and colleagues: accumulate synthetic data alongside the real data instead of replacing it, and the error stays bounded. Never let a generation run train on the previous generation's output.
How to tell whether generated data is any good
IBM's guidance names three tests, and all three are worth running before a model goes near a line:
- Fidelity: does the generated data match the real data statistically, distribution, variance, correlations, and does it look right to someone who knows the product.
- Utility: does a model trained on it perform, measured against a model trained on real data, on the same held-out real test set.
- Privacy: can anything in it be traced back to a real individual. Rarely an issue for product images, central for anything with people or customer records in it.
How we run it on real products
Our sequence is deliberately conservative. You send samples, including ones with the defect you want to catch. We scan them, label the images, train a model, and send a report on what it found and what it missed, before anything is installed on a line. Synthetic data enters in the middle of that loop, to multiply the rare cases you could physically supply, never as a substitute for having supplied some.
On the line itself the same caution applies to the decision. Two networks run side by side at Milarex, one trained on clean product and one on contaminated product, and when they disagree the case goes to a person. Operators then mark false alarms and confirmed detections, so the real data set keeps growing where it matters.
What this means in practice
If you are told synthetic data removes the need for your own defect samples, treat it as a warning sign. Plan instead for a small, deliberately collected real set, with the defects you genuinely fear represented at least a few times, and use generation to broaden it. Insist on a held-out test set of real defects that the model never saw, and judge the project on that.
That is how our X-ray test for Mondelez was structured, and it is why Firecrux X-Ray QC keeps operators in the loop after go-live rather than before it. If you have a defect your current equipment cannot see, sending samples is the fastest way to find out whether anyone's AI can: that is what a two-week proof of concept covers.


 Any questions? Let's talk!
 Write to us,